
Statistics
We publish a range of statistics from the Motor Vehicle Traders Register.
Trader statistics
The table below shows the number of registered motor vehicles traders in each month.
| Year | Jan | Feb | Mar | Apr | May | Jun | Jul | Aug | Sep | Oct | Nov | Dec |
|---|---|---|---|---|---|---|---|---|---|---|---|---|
| 2020 | 3,221 | 3,208 | 3,157 | 3,096 | 3,059 | 3,094 | 3,119 | 3,121 | 3,097 | 3,092 | 3,087 | 3,076 |
| 2021 | 3,072 | 3,067 | 3,057 | 3,081 | 3,103 | 3,083 | 3,060 | 3,055 | 3,043 | 3,044 | 3,058 | 3,055 |
| 2022 | 3,042 | 3,027 | 3,008 | 3,010 | 3,020 | 3,020 | 3,012 | 3,004 | 2,994 | 2,985 | 2,950 | 2,940 |
| 2023 | 2,912 | 2,887 | 2,875 | 2,860 | 2,865 | 2,876 | 2,880 | 2,893 | 2,890 | 2,891 | 2,921 | 2,909 |
| 2024 | 2,910 | 2,923 | 2,907 | 2,892 | 2,880 | 2,852 | 2,860 | 2,870 | 2,880 | 2,872 | 2,833 | 2,810 |
| 2025 | 2,789 | 2,765 | 2,841 | 2,765 | 2,662 | 2,633 | 2,631 | 2,607 | 2,591 | 2,603 | 2,595 | 2,599 |
| 2026 | 2,597 | 2,603 |
Monthly motor vehicle traders statistics by year – 2004 to 2026 [XLSX, 18 KB]
A year in numbers (2024 to 2025)
Registration and complaints statistics for the 2024 to 2025 financial year
The figures below refer to 1 July 2024 to 30 June 2025.


Text description of images
Number of registered traders
- 2633 (at 30/06/2025)
Licensing outcomes
- Registrations cancelled: 4
- Bans confirmed: 3
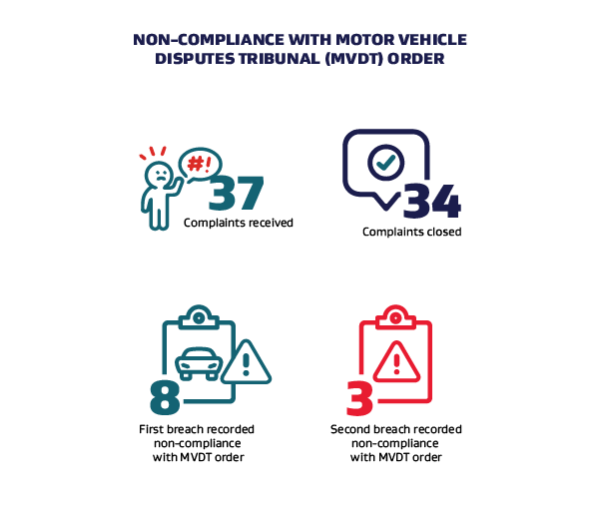
Non-Compliance with Motor Vehicle Disputes Tribunal order
- Complaints received: 37
- Complaints closed: 34
- First breach recorded: 8
- Second breach recorded: 3
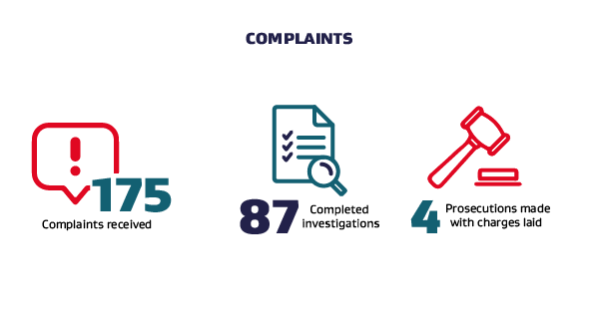
Complaints
- Complaints received: 175
- Completed investigations: 87
- Companies/individuals convicted of offences: 4
Statistics from previous years
-
A year in numbers 2023 to 2024
Registration and complaints statistics for the 2023 to 2024 financial year.
-
A year in numbers 2022 to 2023
Registration and complaints statistics for the 2022 to 2023 financial year.